Franz X. SCHÜTZ & Chrystina HÄUBER
Institute of Archaeology
University of Bonn, D-53113 Bonn, Germany
{fxs, chrystina.haeuber}@uni-bonn.de
The research project FORTVNA was initiated in 1994 by the classical archaeologist C. Häuber and the programmer and geographer F.X. Schütz. The purpose of this project is the development of the archaeological information system FORTVNA, of which the prototype is ready. FORTVNA has been developed as an interactive tool and offers the opportunity a) to search for persistent ancient structures and b) to reconstruct ancient buildings and landscapes more precisely than previous methods. The first area tested with this system is that of the Mons Oppius in Rome. Partners in this project are the archaeological agencies of the City of Rome and university professors of Classical Archaeology, Ancient History, Classics, Geography and GIS. For places with a complex history, such as Rome, the search for persistent structures in the current layout of the city („Stadtgrundriss“) is one of the main objectives of topographical studies. Therefore, one aim of our interdisciplinary research was the development of a corresponding method. For the level of correlation of spatial structures we have coined the technical term PX = Index of persistence ("Persistenzindex"). The PX method is formulated as an algorithm. We will show the application of this new method, as well as results obtained with it. The results are reconstructions of ancient buildings in plan which do not exist any more. The source material analysed consists of (old) aerial photographs, (old) maps, plans, cadastres and excavation reports and drawings.
Information Systems consist of a Database and a Database Management System (DBMS), hardware, software and data. Database Management Systems (DBMS) provide functions for storage, retrieval and analysis of data. Archaeological Information Systems are Information Systems applied to Archaeology.
"The city of Rome is the largest archaeological site in the world, capital and showcase of the Roman Empire and the centre of Christian Europe" (Claridge, 1998). We may add that numerous scholars all over the world, who are studying its complex history, are publishing their results in more than 25 modern languages, a fact which has been pointed out by Prof. J. Rasmus Brandt, the president of the Associazione Internazionale di Archeologia Classica (AIAC) at the XVth International Congress of Classical Archaeology, held in Amsterdam 1998 (Brandt, 1999).
As there does not exist an information system developed for the special needs of (classical) archaeologists, the Classical Archaeologist C. Häuber and the programmer and geographer F.X. Schütz decided to develop the first software of this kind themselves. Starting the ongoing research project named FORTVNA in 1994, the purpose of this project is to develop the “Archaeological Information System” by the same name.
GIS-technology and remote sensing are commonplace for archaeologists who study vast areas and/ or prehistoric sites, which have not been buried under modern cities so far, or were destroyed by modern agricultural techniques, etc. By using aerial photographs and elevation models, these scholars aim at finding ancient sites or settlement patterns, streets or waterways, historic coastlines and landscapes and are thus for example able to understand the locations of sites in greater detail, or of visualizing ancient economic, social and political processes, etc. (Aldenderfer, Maschner, 1996; Allen et al., 1990; Holtcomp, 1996; Lock, Stancic, 1995; Petrie e al., 1995; http://www.jpl.nasa.gov/radar/sircxsar/archaeology.html) .
Seite 283
Contrary to those fields of research, the application of GIS-technology and remote sensing is rarely found with research projects run by classical archaeologists who are interested in urban areas (for which the use of maps of the scale 1: 500 and finer becomes essential). One reason may be that digital cadastres and/ or photogrammetric surveys are not available for every city yet, another that the current GIS softwares were not developed for their special requirements. Even more serious may be the reason - at least in German speaking countries - that studies in classical archaeology (contrary to studies in prehistory) do not comprise courses in which the application of these softwares is taught.
The city of Rome is characterized by the fact that the location of its historic centre has never been moved since antiquity and that the urban area inside the Aurelian city-wall (of c. 19 km length) of the 4th century A.D. was almost completely built over again by the late 19th century. After the fall of the Roman Empire and the decline of the city during the Middle Ages, vast areas inside the Aurelian city-wall, which were thickly populated in antiquity, were now used for agricultural purposes, for example as vineyards. The fact that the area of the historic centre is nowadays almost completely sealed again and has at the same time been used throughout the c. 3000 years of its history in many different ways, makes studying the ancient structures or the topography of the ancient city extremely difficult.
But Rome is also the archaeological site for which the richest documentation is available. Many ancient buildings are still standing, others, which do not exist any more, are visible on the large number of old maps, cadastres, plans and excavation drawings, which have been produced since the Renaissance, not to mention the vast number of archaeological finds, which are to be found in the many archaeological museums. In addition to this, countless artists drew and painted the City´s major buildings, be they constructed in antiquity or later. Thanks to the numerous excellent archives and libraries, the holdings of which add to the reasons why so many research projects are focused on Rome, every conceivable aspect of life in the ancient city can be studied there.
Scholars who are interested in the topography of ancient Rome frequently use the old maps, plans and drawings mentioned above, and the results of their work are not only important for the interested scholarly community, but also for people who work for other departments of the national and the municipal administrations in Rome than the archaeological agencies. It is in this field, the analysis of old map sources, at least to our mind, where the application of GIS-technology and remote sensing can add to the many sophisticated methods developed by scholars who have studied the topography of ancient Rome since more than 1000 years, which, so far, have mostly been `paper based´. The archaeologists of the archaeological agencies in Rome are using these new methods for their work for some time now (D´Elia, 1994, La Rocca 2001).
Many of the old maps of Rome are not very precise, which is why the major problem related to the study of them concerns the evaluation of the information which they contain. In case the ancient structure visible on an old map does not exist any more, its size in plan and its precise locations may be of special interest. Very often the ancient structure visible on an old map will also appear on other maps, or will even have been drawn in elevation by one of the many artists who documented all parts of Rome before photography was invented. In case a number of ancient structures are visible on different old maps, it will be possible to check, whether their “relative location” or topology was precisely recorded by those maps, that is, whether they show the same ancient structures on the same side of the same road and always in the same sequence.
The precise location of ancient structures and/ or of other topographical features, which do not exist any more is important in so far as reports of earlier centuries may describe these topographical features in detail. Very often such reports mention archaeological finds, which were excavated there, including inscriptions, sculptures etc., which can be identified with luck and which help to understand the former function of the ancient structure in question. Sometimes different old maps and plans show the same ancient structure in different state of preservation, and the archaeologist, studying this building and exploiting the above mentioned material, would like a) to locate the documented remains of this ancient building as precise as possible in the current cadastre, and b) to reconstruct it in plan and (if possible) also in elevation.
Another problem concerning old maps is the fact that maps/ cadastres (e.g. R. Lanciani's FUR, fig. 3) may contain buildings/ topographical features which did not exist any more at the time of the publication of these
Seite 284
map sources; even worse are those cases when a map/ cadastre contains structures, which at the time when the map was sent to the press were only planned but that were never actually built. The layout of the City („Stadtgrundriß“) of Rome is constantly changing. This makes it sometimes difficult to locate the „findspot“ of archaeological finds which were excavated in the past. In this case it may be necessary to reconstruct that part of the layout of the City in order to understand the excavation report (see fig. 5, left).
Partners in this project are the two archaeological agencies of the City of Rome and university professors in Italy and in the United States of Classical Archaeology, Ancient History, Classics and Geography, who are specializing in the history and topography of ancient Rome and in GIS. It is the level of precision which our Roman partners need for their work that we aim at with the software FORTVNA as well.
Current Information Systems are mostly based on Relational Database Management Systems (RDBMS, Codd 1970). These Systems can´t handle complex data, concerning the spatial and temporal dimensions in an efficient way. Therefore OO-Systems (OO = object-oriented) are being used to develop applications that emulate real-world conditions, like space and time (Frank, Egenhofer, 1988). This is the reason why FORTVNA has an object-oriented approach. An example for such complex data concerning an object with its spatial and temporal dimensions is the Colosseum in Rome. By using GIS methodology every map/ plan in the System is georeferenced, which means that every piece of information it contains is precisely located. This allows the „transformation“ of information contained in older maps into the current cadastre. All this is not new to those who know GIS. New is that we are developing the first Archaeological Information System which contains GIS functions for the special needs of Classical Archaeologists, who are interested in urban areas (scale 1:500 to 1:200 and finer). New is also that the user of FORTVNA is not assumed to have any special computer training. FORTVNA is supposed to support the research of scholars who study the topography of ancient Rome. FORTVNA has been developed as an interactive tool and offers the opportunity a) to search for persistent ancient structures and b) to reconstruct ancient buildings and landscapes more precisely than previous methods.
The prototype of FORTVNA is ready. In January 2001 we have started the test- and evaluation phase. This project phase is scheduled for 2 years. Our goal is to publish by the end of this phase the release version of FORTVNA in the Internet and for students free of charge.
There are different views concerning the way topographical studies should be performed. C. Häuber´s view is that topographical studies aim at reconstructing a given historical situation. For our test area in Rome she has collected records relating to the ancient landscape and to ancient architecture, as well as literary sources and archaeological finds (ancient inscriptions and sculptures). For this reason one part of this release will be a detailed technical tutorial and a manual which describes the methodology of topographical studies (both written by the authors of this contribution). The latter will be exemplified with data concerning our test area in Rome.
- Source in C, C++, running on Windows, Mac OS, Linux (FORTVNA.EXE 106 KB)
- Direct import of vector/ raster data (ESRI SHP, AutoCAD DXF, Windows BMP, no limit in size)
- GPS and totalstation interface
- Database interfaces
- Objectlist and Commentary (maps, hyperlinks, images, text [all information in the Objectlist is stored in ASCII format])
- Digitizing of objects (point, line, polyline with x,y,z coordinates and „timestamps“)
- Georeferencing of raster and vector data
- 3 and 4 parameter transformation of coordinates
- spatial features stored in ESRI SHP or AutoCAD DXF Standard
- Measuring features (distance)
- Construction of right angles
- Zoom in/ out
Seite 285
- User defined Palettes (colors, lines, patterns)
- PERSIST function (analysis of persistent structures)
4.3 The PX method
For places with a complex history, such as Rome, the search for persistent structures in the current layout of the city („Stadtgrundriss“) is one of the main objectives of topographical studies. Therefore, one aim of our interdisciplinary research was the development of a corresponding method. For the level of correlation of spatial structures we have coined the technical term PX = Index of persistence ("Persistenzindex", cf. Schütz, 1999; Häuber, Schütz 2001a, 2001b). The PX method is formulated as an algorithm (see infra). We will show the application of this new method, as well as results obtained with it (figs. 7, 9).
In general the index of persistence PX is a measure for the degree of correspondence between spatial patterns. In our example the PX is the ratio of the length of line objects in two maps, which were drawn at different times and which show the same structure in different stages of preservation. The PX has 2 parts (values) for example PX = 1;300. The first part can assume values between 0 and 1. This value indicates the degree of „identity“ of two spatial structures in percent (0-100%). The parameters for the calculation of the first value are depending on the source material and data and on the question to be addressed. The second value stands for the difference of the two dates indicating a timespan for which one wishes to test, whether there are persistent structures (for example 300 = 2000-1700; numbers indicating years).
A PX of 1;300 means that the studied spatial structures are identical (persistent) throughout a timespan of 300 years. In case the spatial structures represent walls, this PX would indicate that all walls remained unchanged between 1700 and 2000. The PX of 0,5;300 means that only 50 % of the walls remained identical throughout 300 years.
The core of the PX method is based on the simple fact that the parallel course of lines mathematically can be demonstrated by the comparison of their gradients. Spatial structures, for example lines, can be called persistent in case their course in two maps dating in different times is equal or else very similar. Equal/ similar means in this case that two lines are in full length parallel or approximately parallel, or parts of these lines are parallel.
The PX method can be formulated as an algorithm as follows (after Häuber, Schütz 2001b):
1. Selection of the source objects and of the objects to be compared with.
2. Selection of the test area (for example selection of objects inside a box drawn on the map).
3. Selection of the parameters distance and deviation of gradient depending of the source material and of the uncertainty of data.
4. Start of search for objects with the defined distance in the set of objects to be compared with the first source objects.
5. Marking of the objects found and comparison of the gradients of these objects with the given deviation of gradient in the set of objects to be compared with.
6. If the gradients of the objects found fall within the given limits write the ID of the source-object and the ID of the compared object in a new file.
7. Return to 4 until all source objects are compared.
8. Calculation of the PX as value of the length of lines in the defined test area (for example for walls).
In order to test FORTVNA, we chose a test area in Rome, since the complexity of this site has no equals. This means, in case the information system FORTVNA should be able to cope with these requirements, it should also be possible to use it for any other (less complex) archaeological site in the world. The software is named after the Roman goddess Fortuna (fig. 10), who had a sanctuary in our test area in Rome. The first area tested with this system is that of the eastern part of the Mons Oppius in Rome (figs. 1,2).
Seite 286

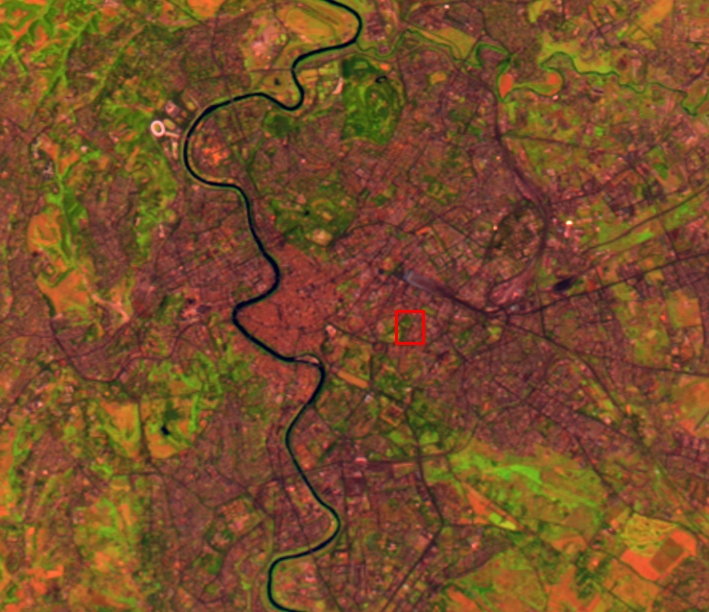
Figure 1. Our test area in Rome (marked by the red rectangle), the eastern part of the Mons Oppius. LandSat data from July, 25th 1992 with TM bands 5, 4, and 2. With general permission of NASA - Goddard Space Flight Center, Scientific Visualization Studio (cf. http://svs.gsfc.nasa.gov/imagewall/LandSat/rome.tif May, 6 2001).
Our test area in Rome is the eastern part of the Mons Oppius, located on the left bank of the Tiber river, east of the Colosseum (fig. 1). On this satellite image the Tiber river is clearly visible, running from north to south, as well as the railway station „Stazione Termini“ north of our test area.
The area is bounded by modern roads, in the south by the Via Labicana and in the east by the Via Merulana (fig. 2). Notice the huge oval shaped building in the bottom left corner of the aerial photograph (fig. 2), the Colosseum. The area between the two streets comprises one of the foot-hills of the Esquiline, the Mons Oppius, which in antiquity stood ca. 30 m (today 10 m) above the bottom of the valley. From the 4th century BC until the 5th century AD some important sacred and public ancient buildings stood on top of this hill (fig. 7), which have been documented since the 17th century until the beginning of the 20th.
The results of our research are reconstructions in plan of ancient buildings (fig. 7), which do not exist any more. The source material analysed consists of (old) aerial photographs (figs. 2, 8), (old) maps (figs. 3, 4 left), plans, cadastres (figs. 7, 9), photogrammetric surveys (figs. 6, 8) and excavation reports and drawings (fig. 5 left, inserted box). Contrary to scholars and researchers in other fields, (Classical) Archaeologists are often interested in old (aerial) photographs, which may show the ancient buildings/ topographical features which they are studying in much better state of preservation, and/ or which have the further advantage that they are in most cases precisely dated, which helps to evaluate their other map sources.
Seite 287
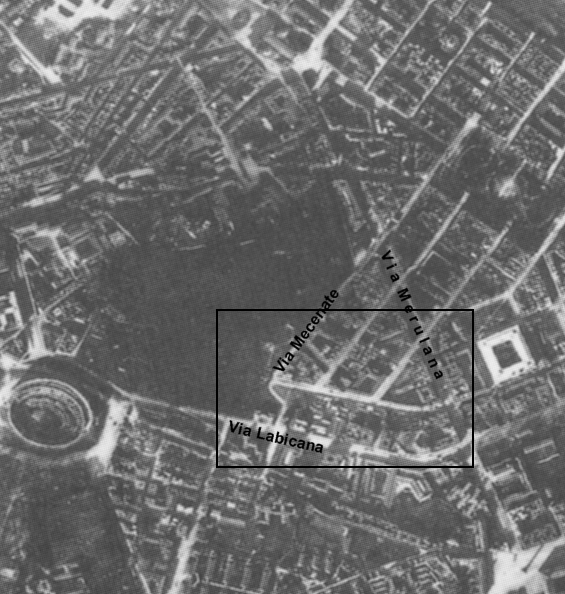
Figure 2. Aerial view of Rome, taken by Umberto Nistri on February 11., 1919. Data source: Comune di Roma 1996, p. 30 (after: Frutaz, 1962).
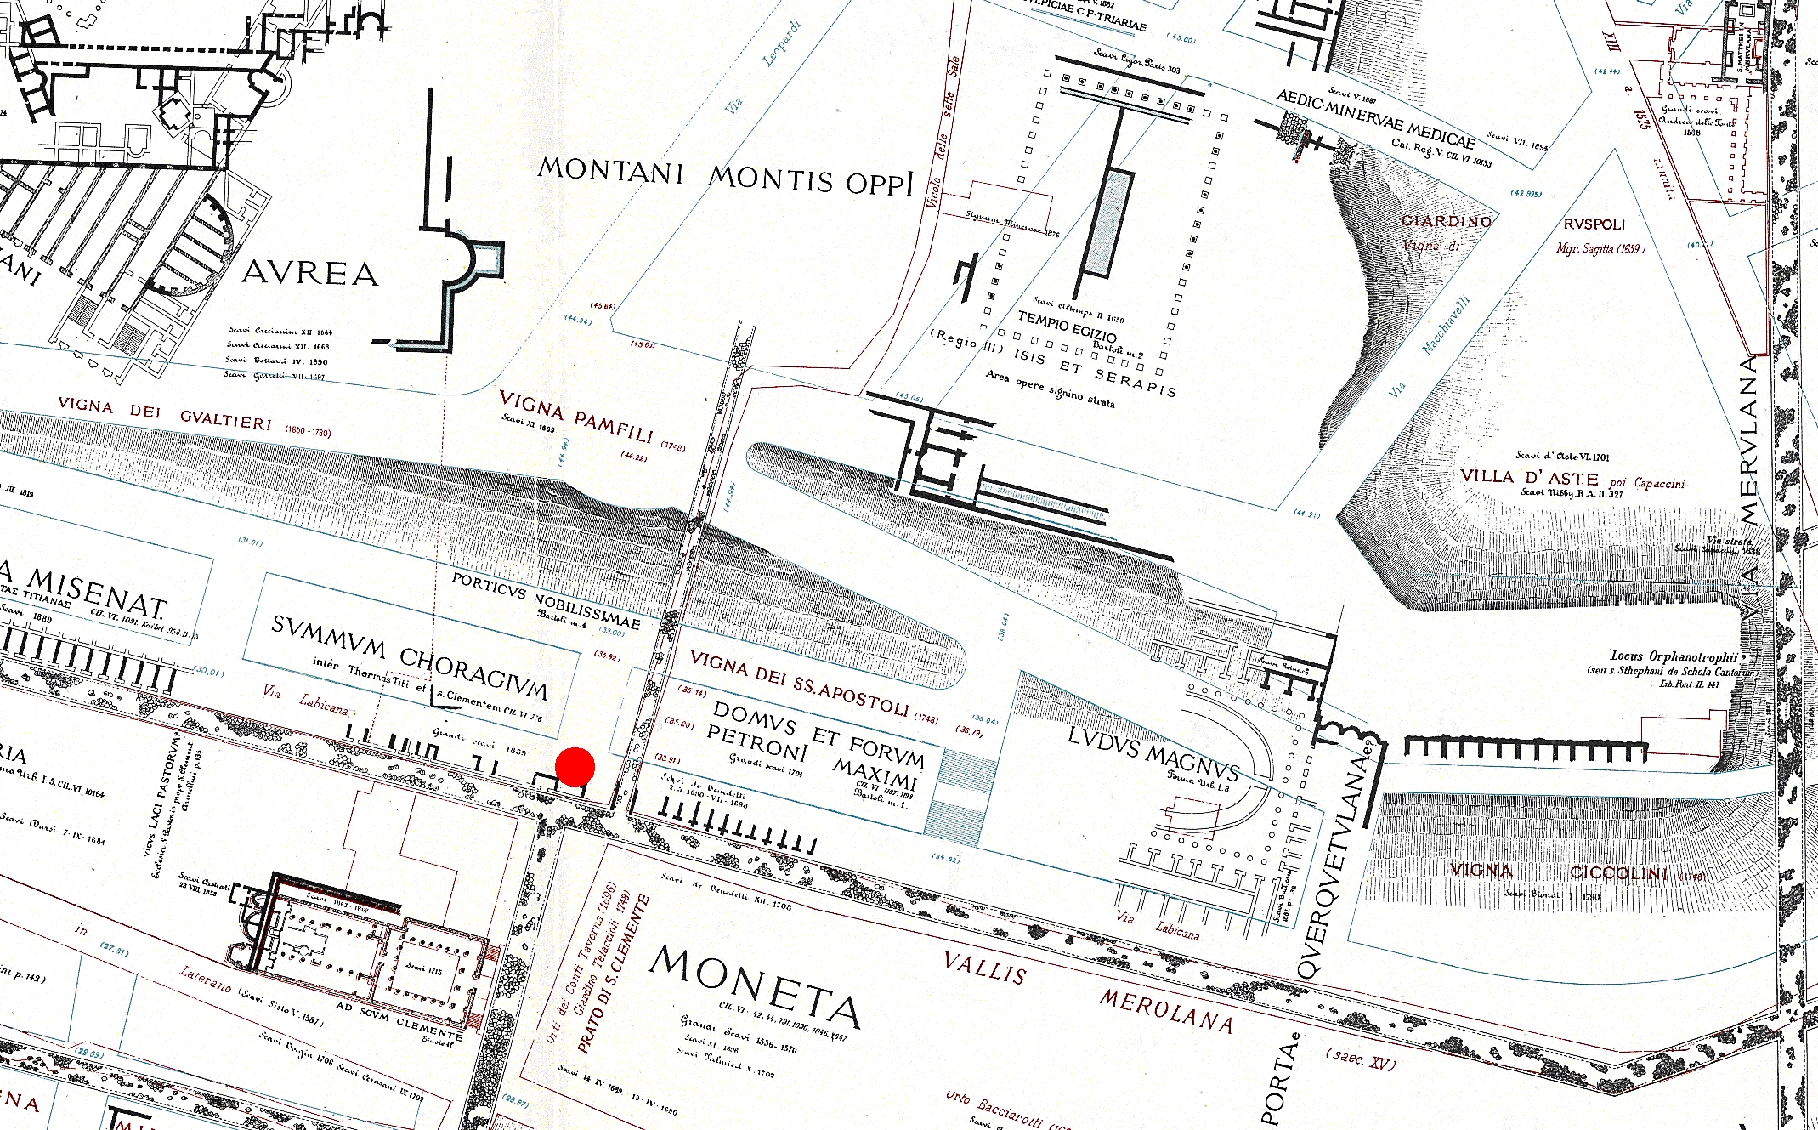
Figure 3. Lanciani, R., 1893-1901. Forma Urbis Romae. Milano. Foglio 30 (detail).
Figure 5 left shows the findspot of the portrait statue of Augustus “from the Via Labicana”. The statue was found in a foundation wall of a modern building. A plan was published by A. Pasqui (Notizie degli Scavi 1910, 223-228, esp. 224, fig. 1), see the inserted box on fig. 5 top left. According to Pasqui's plan the building stood at the junction of the modern roads of the Via Labicana and the Via Mecenate; notice that both roads form in plan a right angle. Lanciani's Forma Urbis Romae (fig. 3) does not show a junction of the Via Mecenate (at his time: Leopardi) and the Via Labicana (see fig. 3, red dot), nor does it exist today (see fig. 9, black dot).
Seite 288
An aerial photograph, taken on February 11th, 1919 (fig. 2), which shows the junction of the Via Mecenate and the Via Labicana, solves the problem. See fig. 8 (red dot), an overlay of the aerial photograph (fig. 2) and the photogrammetric survey, which shows where this former junction of the Via Mecenate and Via Labicana must have been located. Figure 5 was made by overlaying two digitized and geo-referenced layers: using the aerial photograph taken in 1919 (fig. 2) and another aerial photograph taken in 1990 (Comune di Roma, 1996, pl. 167). In addition to this we inserted Pasqui's plan of the findspot (cf. Häuber, Schütz 1999).
|
|
|
|
|
|
Figure 5. The portrait statue of Augustus „from the Via Labicana“ and its findspot. Left: From Häuber, C., Schütz F.X. 1999, fig. 71; right: Rome, Palazzo Massimo. Photo: Inst.Neg.Rom 65.1111.
Seite 289
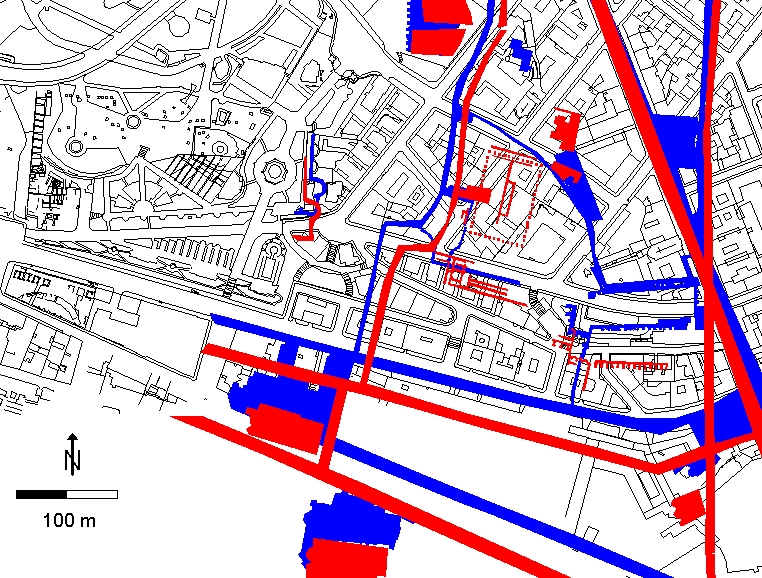
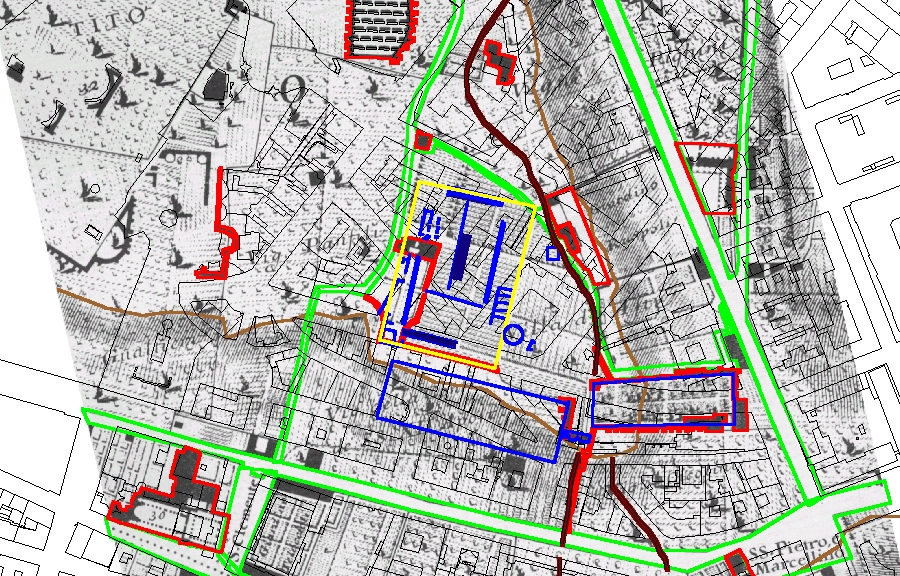
Figure 7. Our preliminary reconstruction of ancient buildings in plan, using Nolli (fig. 4 left), excavation drawings of the 19th century and results obtained by applying the PX method. In the background the current cadastre.
Seite 290
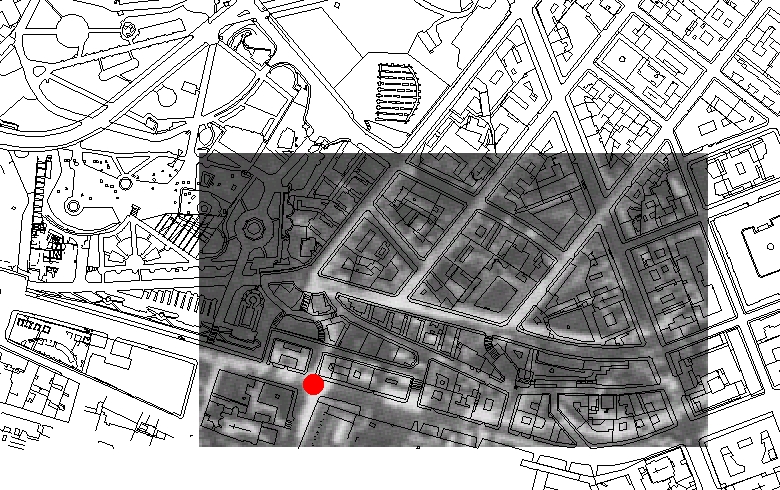
Figure 8. The photogrammetry and a detail of the aerial view (fig. 2).
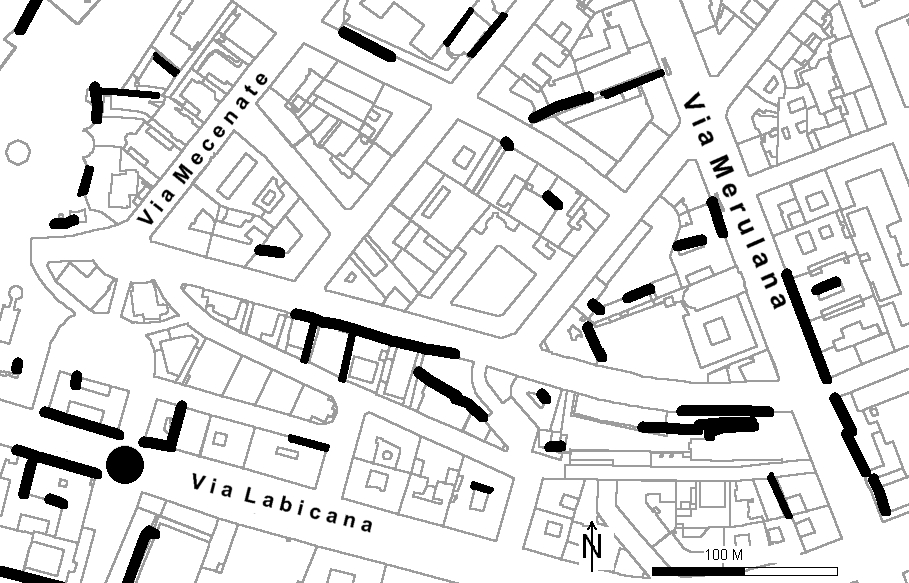
Figure 9. Current cadastre with black lines indicating `zones´ containing persistent ancient structures that are already visible on G.B. Nolli’s map (fig. 4 left), analysed with the function PERSIST.
In order to reconstruct the ancient buildings in our test area in plan, which have been documented from the 17th century until the beginning of the 20th century, we first evaluated the old maps by Lanciani (fig. 3) and Nolli (fig. 4 left), by digitizing those streets and buildings, which are visible on Nolli’s map and also on Lanciani’s map, and which are important in so far, as they appear in those excavation reports which describe the ancient buildings of this area. Since many of these topographical features do not exist any more, we wanted to know, whether we would be able to locate them in the current cadastre. The topographical features found in Nolli (blue) and in Lanciani (red) and the photogrammetric survey were superimposed; this led to unexpected results (fig. 6). Whereas the locations of these structures on Nolli’s map proved to be very reliable, Lanciani’s map shows the same structures in some cases more than 30 m away from their true locations, which means that at least in our test area Lanciani’s locations of those ancient structures which do not exist any more is not very reliable.
Seite 291
We then applied the PX method to a comparison of Nolli’s map (fig. 4 left) with the current cadastre, which resulted in the map fig. 9. This shows persistent structures, some of which C. Häuber could identify as ancient walls (cf. Häuber & Schütz 2001 a,b). Combining these results with informations gathered in excavation reports and measured drawings of the late 19th century until the beginning of the 20th century, resulted in our preliminary reconstruction of ancient buildings in plan (fig. 7). Especially difficult proved to be the reconstruction in plan of an ancient building, of which parts are preserved in Via Pasquale Villari, because its eastern part is today inaccessible. Since Nolli (fig. 4 left) and Lanciani (fig. 3) drew its plan differently, we were lucky to find this ancient structure pictured on an etching by G. Vasi (fig. 4 right), which seems to be the only representation of the eastern part of this building in elevation. Whereas in Nolli’s map north is above and the ancient building now in the Via Pasquale Villari appears north of the Via Labicana, opposite the Church of SS. Pietro e Marcellino, Vasi drew the same buildings while standing east of them.
In past centuries many ancient sculptures were found in this area, for example the portrait statue of Augustus (fig. 5 right), but only three of these had once belonged to overlifesize statues: one head of the Egyptian god Serapis of the Bryaxis-type (fig. 11 right), a statue representing Aion, from a copy of a statue of Serapis of the same type? (fig. 11 left) and a fragmentary cornucopia from an overlifesize statue of (Isis-?)Fortuna (fig. 10 right). It is tempting to believe that these sculptures had once been parts of cult images, dedicated in the sanctuaries located here by recent commentators, for example the sanctuary Isis and Serapis in Regio III (de Vos, 1997; Ensoli, 1997; Häuber, 2001). The fragmentary cornucopia (fig. 10 right) may have belonged to a statue of Fortuna of the Braccio Nuovo-type like the statue of Isis-Fortuna (fig. 10 left), and we may further ask, whether this statue, found north of our test area, may have copied the cult statue of (Isis-?)Fortuna, of which only the cornucopia (fig. 10 right) is left.
|
|
|
Figure 10. Left: statue of Isis-Fortuna (1,46 m high). Rome, Musei Capitolini. Photo: Archivio Fotografico Capitolino.Right: lost fragment of a marble cornucopia from an overlifesize statue of (Isis-?)Fortuna (0,73 m high). Photo: Inst.Neg. Rom 239a (detail).
Seite 292
|
|
|
Figure 11. Left: Overlifesize marble statue of Aion, Rome, Villa Albani (inv.no. 779; 1,65 m high). Photo: Inst.Neg. Rom 41.94. Right: Head from an overlifesize marble statue of Serapis. Rome, Museo Capitolino (inv.no. 1217; 0,61 m high). Photo: Archivio Fotografico dei Musei Capitolini.
Aldenderfer, M., Maschner, H.D.G. (eds.), 1996. Anthropology, Space, and Geographic Information Systems. Oxford University Press. New York, Oxford.
Allen, K.M.S., Green, S.W., Zubrow, E.B.W. (eds.), 1990. Interpreting space: GIS and archaeology. Taylor & Francis, London-New York-Philadelphia.
Brandt, R., 1999. The XVth International Congress of Classical Archaeology, 12-17 July 1998. In: Proceedings of the XVth International Congress of Classical Archaeology, Amsterdam, July 12-17, 1998, Text, Allard Pierson Series 12, Amsterdam 1999, p. XIV.
Comune di Roma, 1996. Atlante di Roma. La forma del centro storico in scala 1:1000 nel fotopiano e nella carta numerica. Venezia, 4. edizione.
Claridge, A., 1998. Rome. An Oxford Archaeological Guide. Oxford University Press, paperback, back cover.
Codd, E.F., 1970. A Relational Model for Large Shared Data Banks. Communications of the ACM, 13(6), pp. 377-387.
D´Elia L. S. , 1994. Problemi di Codifica in un Data-Base Territoriale. In: Comune di Roma - Regione Lazio (eds.), 1994. La Cartografia dei Beni Storici, Archaeologici e Paesistici nelle Grandi Aree Urbane dal Censimento alla Tutela. Atti del Convegno, Roma, 26-27-28 Aprile 1990, Roma, Edizioni Quasar, pp. 99-102.
de Vos, M., 1997. Dionysus, Hylas e Isis sui Monti di Roma. Roma, pp. 99-154.
Ensoli, S., 1997. Various articles in: Iside. Il mito il mistero la magia. Milano. pp. 306-321.
Frank, A. & Egenhofer, M., 1988. Object-Oriented Database Technology for GIS: Seminar Workbook. NCGIA, University of Maine. Seminar Presented November 29, 1988, San Antonio, Texas, GIS/LIS 89.
Frutaz, A.P., 1962. Le piante di Roma I-III. Roma.
Seite 293
Häuber, C., 2001. ... et in lucos silentia ipsa adoramus (Pliny, HN 12.3). The horti Romani: Amidst Forest, sacred Grove and Arbor. Between Domus Aurea and horti Maecenatis: The sanctuary Isis et Serapis in Regio III (forthcoming).
Häuber, C. & Schütz, F.X., 1999. The multi-disciplinary multimedia Geographical Information System applied to archaeology GIS[A] FORTVNA: the basics of development. In: Proceedings of the XVth International Congress of Classical Archaeology, Allard Pierson Series 12. Amsterdam, pp. 194-196, figs. 70-71.
-, 2001a. Einführung in Archäologische Informationssysteme. Übungsbuch. Erste Auflage. Bonn (forthcoming).
-, 2001b. The Analysis of Persistent Structures: A Functionality of the Archaeological Information System FORTVNA. In: Strobl, J. et al., Angewandte Geographische Informationsverarbeitung. Beiträge zum GIS-Symposium 4.-6. Juli 2001, Salzburg (in press).
Harari, M., 1997.Archeologia Dal Cielo. In: ARCHEO, Anno XII, numero 5 (147), Maggio 1997, pp. 49-85.
Holcomb, D.W., 1996. Radar Archaeology: Space Age Tool Aid in Uncovering the Past. in : EOM (Earth Observation Magazine), Volume 5, Number 9, September 1996, pp. 22-26.
La Rocca, E., 2001. The project „Nuova Forma Urbis Romae“. In: APA, 132nd Annual Meeting, Abstracts, San Diego, CA, January 3-6, 2001, p. 200.
Lock, G., Stancic, Z. (eds.), 1995. Archaeology and Geographical Information Systems: A European Perspective. Taylor & Francis, London.
Petrie, L., Johnson, I., Cullen, B. & Kvamme, K., 1995. GIS in Archaeology: An Annotated Bibliography. Sydney University Archaeological Methods Series 1 (105pp). http://www.archaeology.usyd.edu.au/resources/databases/gis_biblio/ (May 1., 2001).
Schütz, F.X., 1999. GIS-gestützte Analyse von persistenten Strukturen in der Kölner Innenstadt auf der Basis der Kataster von 1836/37, 1938/39, 48 und dem aktuellen Kataster. Unpublished Diplomarbeit, Universität Bonn, Geographische Institute.
Zeppegno, L., Mattonelli, R., 1975. Le chiese di Roma. Roma.
Our partner in the FORTVNA project, Prof. E. La Rocca of the Sovraintendenza BB.CC. of the Comune di Roma (the archaeological agency of the Municipality of Rome, Italy), kindly provided us with the maps, the cadastre and the photogrammetric survey used for our research and shown here (figs. 3,6-9), which were generated for his `Centro di Documentazione Forma Romae´ (`documentation centre for the map of Rome´). We also thank the director of the Musei Capitolini, Dr. A. Mura Sommella for the permission to publish the photographs of the Archivio Fotografico Capitolino reproduced here (figs. 10 left, 11 right), and Dr. S. Diebner of the Deutsches Archäologisches Institut Abteilung Rom, for the permission to publish the photographs reproduced here (figs. 5 right, 10 right, 11 left).
Seite 294
Datenschutzerklärung | Impressum