F. X. Schütza, C. Häuberb
aUniversität Regensburg, Geographisches Institut, Universtätsstraße 31, 93053 Regensburg, Germany
franz-xaver.schuetz@geographie.uni-regensburg.de
bUniversität Regensburg, Institut für Geschichte, Universtätsstraße 31, 93053 Regensburg, Germany
chrystina.haeuber@geschichte.uni-regensburg.de
KEY WORDS: Archaeology, Geography, Cartography, Accuracy, City, Reconstruction, Visualization
ABSTRACT:
Until recently most of the archaeological maps for the City of Rome were generated by using traditional, „paper based“ methods. These thematic maps are very important for scholars, archaeological agencies, urban planners, public institutions, as well as many other agencies and private individuals. All these potential users need very precise maps. In this paper we describe methods for the creation of very precise digital archaeological maps. We chose two examples from the City of Rome, showing the possible findspot of the famous Laokoon group in the Vatican and the topographical context of a structure which has recently been identified as the tomb of king Servius Tullius by the Italian scholar Filippo Coarelli. For the reconstruction we used the digital cadastre, digital photogrammetric data, digital aerial photographs, as well as excavation reports and -drawings. We will show the advantages of digital methods over „paper based“ methods. In this context the concept of the „Persistenzindex“ is very important. The results are digital maps with reconstructions of ancient buildings in plan. These maps are more precise than maps created with „paper based“ methods, for which we show examples referring to the same area.
KURZFASSUNG:
Bislang wurden archäologische Karten für die Stadt Rom meist unter Anwendung traditioneller, papiergestützter Methoden hergestellt. Derartige thematische Karten sind sehr wichtig für die Forschung, für Fachbehörden, für die Stadtplanung, und für private Belange. Diese potentiellen Nutzer benötigen in der Regel sehr genaue (lagegetreue) Karten. In diesem Beitrag beschreiben wir Methoden für die Herstellung von sehr genauen archäologischen Karten in digitaler Form. Für die Beschreibung haben wir zwei Beispiele aus der Stadt Rom gewählt. Es handelt sich um die Ermittlung des möglichen Fundortes der berühmten Laokoongruppe und um die Rekonstruktion des topographischen Umfeldes eines Gebäudes, das kürzlich als Grab des Königs Servius Tullius angesprochen wurde. Für die Rekonstruktionen haben wir das digitale Kataster der Stadt Rom benutzt, photogrammetrische Daten, Luftbilder, sowie Ausgrabungsberichte und Grabungszeichnungen. In diesem Zusammenhang kommt dem Konzept des Persistenzindex große Bedeutung zu. Wir zeigen, dass die mit „digitalen Methoden“ von uns erzeugten Karten genauer sind als Karten, die vor 13 Jahren mit „papier-gestützten“ Methoden erstellt wurden.
1. INTRODUCTION
Aerial photography has been applied by archaeologists since the beginning of the 20th century (cf. Chevallier 1957; Scollar 1965, p. 9). Remote sensing and GIS-technology are commonplace for archaeologists who study vast areas and/ or prehistoric sites, which have not been buried under modern cities so far (Schneider, 1974, pp. 17, 191; Albertz, 1991, pp. 177-180; Holcomb, 1996; Harari, 1997; Sabins, 1999, pp. 411-415). Contrary to those avenues of research, archaeologists studying urban areas have started using these methodologies only fairly recently (cf. for the city of Rome: Comune di Roma, 1991; D´Elia, 1994; La Rocca, 2001). Since a couple of years a digital cadastre and photogrammetric data are available for the city of Rome. Using these data, it is possible now to create very precise archaeological maps.
During the last decades, the topography of ancient Rome has become a very productive field of study (Frutaz, 1962; Coarelli, 1974-2001a; Lanciani, 1893-1901; Richardson, 1992; Steinby, 1993-2000; Amanti et al., 1995; Claridge, 1998). The Esquiline in Rome and adjacent areas, as well as the horti Maecenatiani, the „gardens“ or rather estate of Maecenas on Mons Oppius (the southwestern lobe of the Esquiline), have been reconstructed by various authors, and with very different results. A survey of these proposals, including a detailed description of C. Häuber's own new reconstruction of the horti Maecenatiani, will be published elsewhere (cf. Häuber, Schütz, 2003), whereas here we wish to discuss the methodology applied for making the accompanying maps. Based on our earlier research, this paper presents preliminary results of our ongoing research project, called „The eastern part of the Mons Oppius“. The aim of this project is to study the ancient buildings of this test area during their lifetime in antiquity and to reconstruct them in an archaeological map.
2. METHODS
Two problems are characteristic for our research:
1. Most of the ancient structures in question were destroyed, or else covered over in the late 19th century, in the course of building a new residential quarter. Our reconstructions of them in plan are based on the excavation reports and -drawings of the period, and on old maps. These old maps document only those parts of the ancient structures, which were visible at their time. This means, modern excavations of these remains would surely result in different ground plans of these structures.
2. Given the nature of the so far mentioned information, it is possible to reconstruct the ancient buildings in plan, and by studying the related archaeological finds, it is also (in theory) possible to date them and to define their original function.
It is a different matter to find out, whether or not these buildings are known through ancient literary sources and/or inscriptions, or from representations on reliefs, coins, etc. And it is, of course, this what we want to know. Progress in this avenue of research is only obtainable by studying our relatively small test area, the eastern part of the Mons Oppius, under a wider perspective. One of these wider perspectives could be the mapping of administrative boundaries of ancient Rome, for example the Augustan city wards (regiones/Regions), datable to 7/6 BCE. Since for some ancient buildings their location in one of those XIV regiones is known, we decided to study our test area in relation to its location within the Augustan Regions. This research resulted in a map with C. Häuber's new reconstruction of the Regions in question (Fig. 8), which we publish here for the first time (see infra, for the applied methodology).
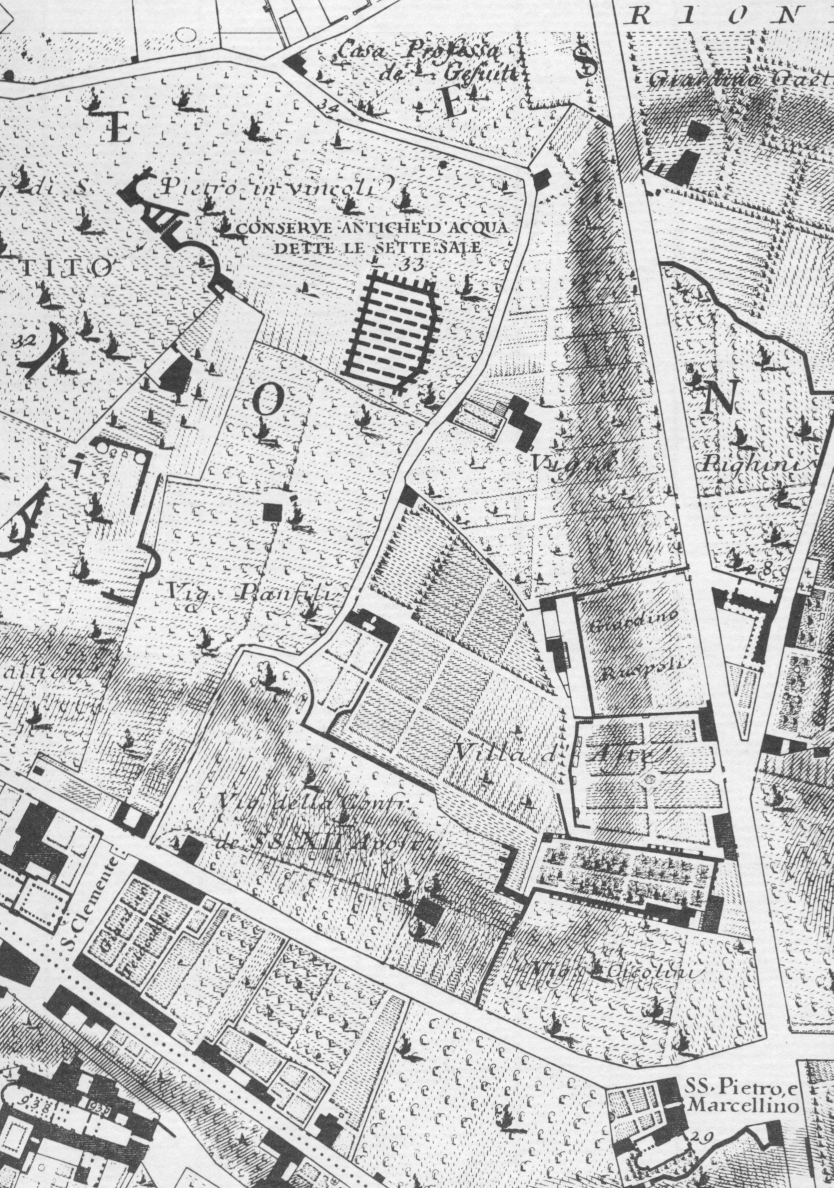
As already mentioned, the analysis of archaeological finds, recovered from an excavation, can help to understand the chronology and/or the nature of the related ancient structures. For many finds recovered in Rome in past centuries, the original ancient context is unknown. On the other hand, there are numerous reports on finds, which were written in exactly this period. R. Lanciani in his pioneering works has collected and systematically exploited these data. As a result, he marked for many of these finds not only their findspots in the modern cadastre, but he was even able in many cases to establish their ancient contexts (cf. Lanciani, 1893-1901, 1902-1913; Istituto Nazionale di Archeologia e Storia dell'Arte, 1989 2000). His results were based inter alia on his profound knowledge of the administrative boundaries of modern Rome throughout its long history. Much of this information is integrated into his famous map Forma Urbis Romae (FUR, fols. 1-46 = Lanciani, 1893-1901). What we actually needed for our research is something else: a separate map with only „one layer“ of this administrative information, the precise location of the former vineyards in and around our test area on Mons Oppius. For the sake of clarity, our map of the vineyards (Vigne) (Fig. 5), which we publish here for the first time, shows only those vineyards, which are documented on Giovanni Battista Nolli's map of Rome (1748, Fig. 1).
Compared with Lanciani's FUR, where the boundaries of Nolli's Vigne (and the boundaries of many other vineyards) are integrated, our digital map has some advantages. The map is georeferenced and we can show these boundaries in an overlay together with the photogrammetric data (fig. 7) (see infra, for the purpose of this map). In addition to this, we can take measurements more easily. Each topographical feature („object“) is stored separately, and can be used at will in any other context. We used an object-oriented Archaeological Information System (a testversion of the AIS Fortvna) to produce our maps, because we found that the obtainable results are more precise than those obtainable with paper based methods (cf. for some preliminary results, as well as the methods employed: Schütz, Häuber 2001; Häuber, Schütz 2001; Häuber, 2001; Häuber, Schütz, 2003). The photogrammetric data of Rome, on which the maps are based, have the further advantage of containing the groundplans of still existing ancient structures, which are usually absent from cadastres; the ancient building called "Sette Sale" (the cistern of the baths of Trajan) (Figs. 5; 7; 8, label „Sette Sale“), visible on all cadastres of Rome, is an exception to this rule. In addition to these extant ancient ruins, the maps (Figs. 5; 7; 8) contain also some ancient and modern streets and buildings, which do not exist any more, but were documented by G. B. Nolli in his map of Rome (1748). Because these topographical features are of interest to our work, we decided to integrate them into the maps. Contrary to C. Häuber's earlier study of this area (Häuber, 1990, map 1-4), we did not integrate any topographical features from R. Lanciani's FUR, since we found in one of our preliminary studies (Schütz, Häuber, 2001, p. 291), that at least in our test area Lanciani's locations of ancient buildings are not reliable. We tested the reliability of his locations of a number of ancient buildings against Nolli's locations of the same structures, which proved to be very reliable. These results were by no means surprising, since many others have made similar experiences before us. We thank especially Dr Luca Sasso D'Elia of the Sovraintendenza BB.CC. of the Comune di Roma and Prof Clementina Panella (cf. Panella, 1996) of the Università di Roma „La Sapienza“ for discussing this point with us, and for showing us the results of their own work related to these problems. Prof. Panella kindly drew our attention to publications by E. Brienza, who has studied the reliability of Nolli's map in detail (cf. Brienza, 1998a,b).
We scanned the relevant four sheets of Nolli's map and merged them into one digital map. We georeferenced this map by using as passpoints ancient structures represented in the photogrammetric data as well as in Nolli´s map. Fortunately, there is a great number of such ancient structures within our test area. Then we digitized the topographical structures in question. As in earlier publications, we made a sytematic search for so-called persistent ancient structures (cf. for the „Persistenzindex“/ Index of persistence, a technical term coined by F.X. Schütz: Schütz, Häuber, 2001, p. 286; Häuber, Schütz, 2001, pp. 228-231) in the photogrammetric data, where they have the form of line objects. (Note that in Italian and French publications, persistent structures may inter alia be called „permanent“ structures). Studying these persistent lines in the light of data gathered in archaeological or geological excavations and surveys, resulted in some cases in previously unknown information concerning ancient structures and/or the urban landscape.
Based on Nolli's own statement that the numerous „dark areas“ in his map (Fig. 1) represent ground plans of ancient structures (cf. Frutaz 1962 III, pl. 418 [caption of Nolli's map]: „Avvertimento: Le Fabriche moderne sono indicate da' tratti meno profondi, e meno oscuri. I tratti più profondi, e più oscuri indicano le fabriche antiche, che restano ancora in piedi“) we studied the relevant „dark areas“ in his map. Then we integrated those structures into our own reconstructions of the ancient structures in question. In addition to this, we made a sytematic search for „lineaments“ (cf. for „lineament“ in this context: Albertz, 1991, pp. 162, 177-180). Finally we consulted recent geological studies on the Oppian (We thank Dr Rita Volpe of the Sovraintendenza BB.CC. of the Comune di Roma for discussing this point with us, and for showing us her own unpublished work on the Oppian (cf. Panella, Arnoldus-Huyzendveld, 1996; Arnoldus-Huyzendveld, 2000; Volpe, 2000).
Figure 1: G.B. Nolli, Map of Rome (1748), detail
3. RESULTS AND DISCUSSION
The application of digital methods resulted in a number of new findings. The example chosen here first (Figs. 1-4) has already been studied by C. Häuber (Häuber, 1990, map 1, here Fig. 2), applying paper based methods. Figure 2 shows those fragments of the Severan marble, which have been located on the Oppian, in the modern cadastre. Ancient structures documented on various old maps were also integrated into this map. The resulting reconstruction (Fig. 2) shows the „round building“, visible on Fragment no. 593 of the Severan marble plan (called „Rundbau“ in Fig. 2). Northeast of this, there are two structures, which were copied from the „Catasto Pio-Gregoriano“, where they have the number 354 (labelled „354“ in Fig. 2). Nolli’s map (Fig. 1) documents only one „dark“ area at this site, obviously an ancient structure. The positioning of this fragment of the Severan marble plan in the modern cadastre has been proven by excavation. The „round building“ has been identified with various ancient buildings known through ancient literary sources (cf. Häuber 2001). According to F. Coarelli (Coarelli, 2001b) it as a „tomba a recinto“, and ought to be identified as the tomb of king Servius Tullius. Our new reconstruction (Fig. 3) was produced by overlaying Nolli’s georeferenced map (Fig 1) and the photogrammetric data. As is evident now, the seemingly two structures east of the „round building“ (Fig. 2, no. 354) were actually remains of the „round building“ itself (!).Figures 2 and 4 show also, that in the Severan period, when the marble plan was carved (datable 203-211 CE), the „round building“ was positioned on a small square by an important multiple junction. By Nolli’s time (1748), it was positioned in an angle between two roads. Its ruin was still extant in the late 19th century, and although its former function was long since forgotten, it still „stabilized“ the position of a street crossing. The differences in precision between the maps (Figs. 2, 3 and 4) can demonstrate the high potential of the digital methodology applied here for archaological research.
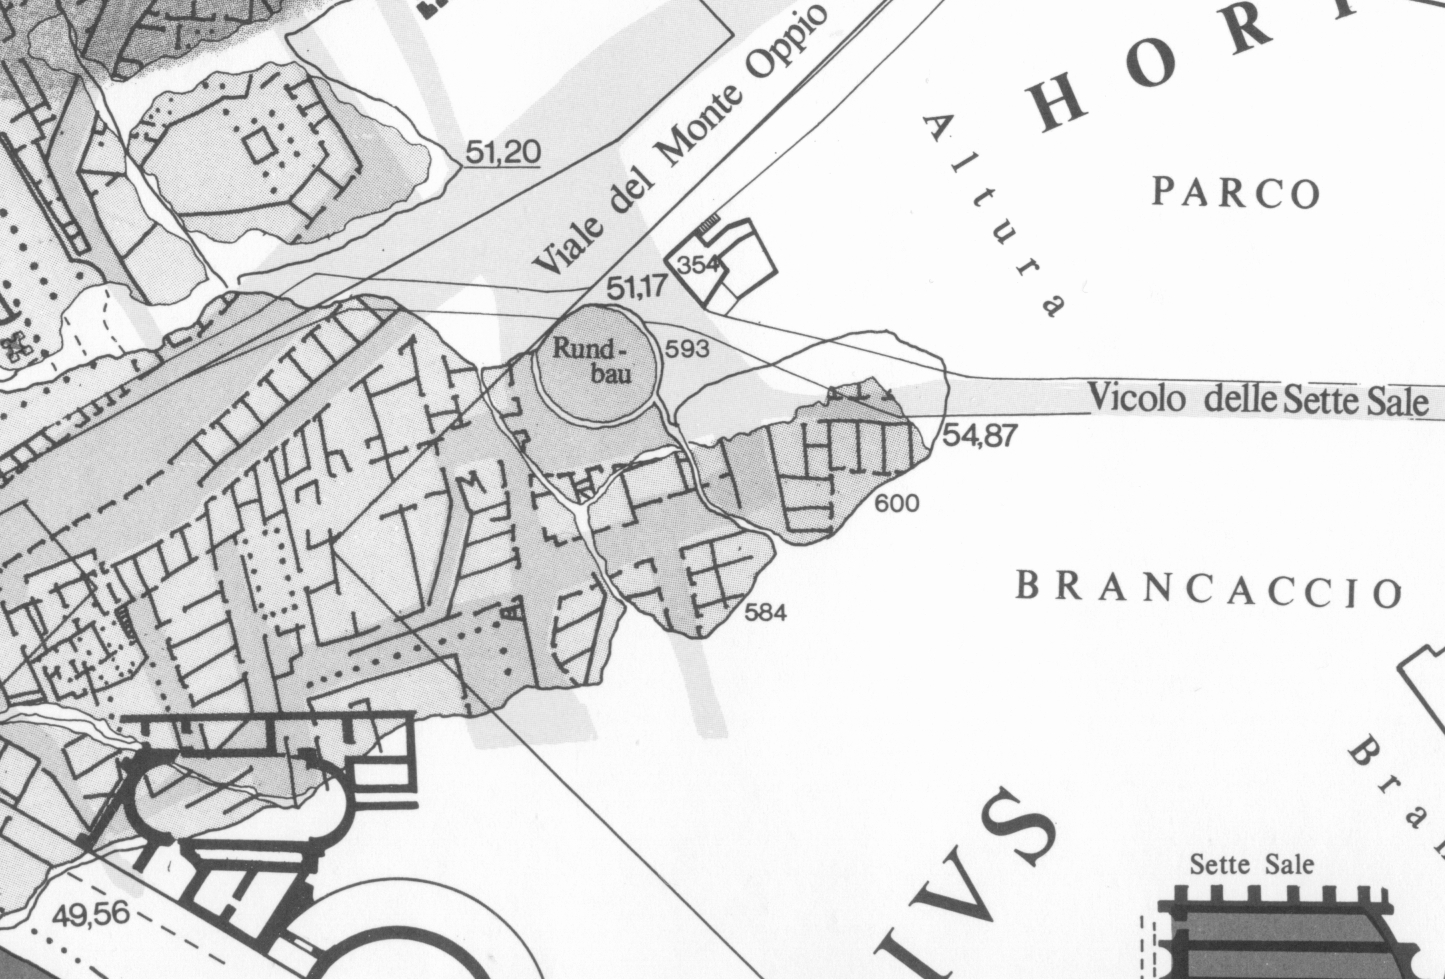
Figure 2: Map of the Horti Maecenatiani, detail. Courtesy Römisch-Germanisches Museum Köln. From: Häuber, 1990, Karte 1
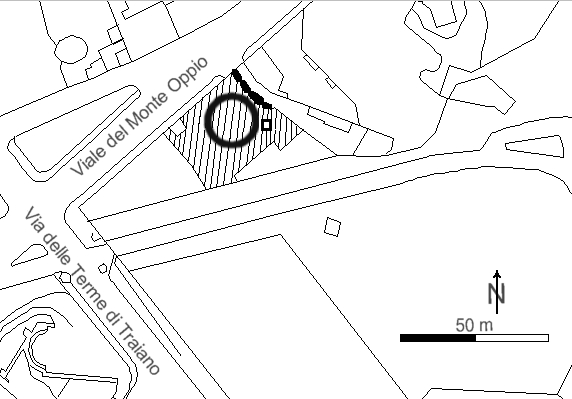
Figure 3: Reconstruction of the archaic sanctuary at the Viale del Monte Oppio. From Häuber 2001, p. 67
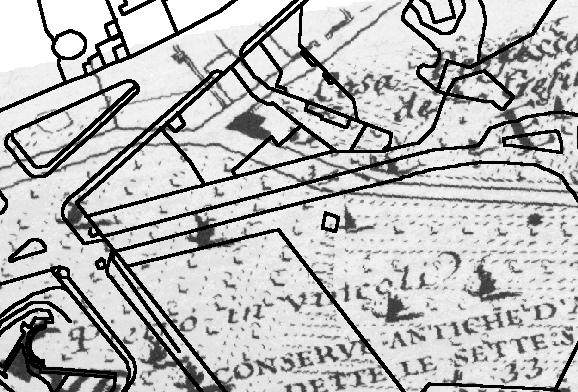
Figure 4: The archaic sanctuary at the Viale del Monte Oppio, Nolli 1748 and photogrammetric data. From Häuber 2001, p. 67
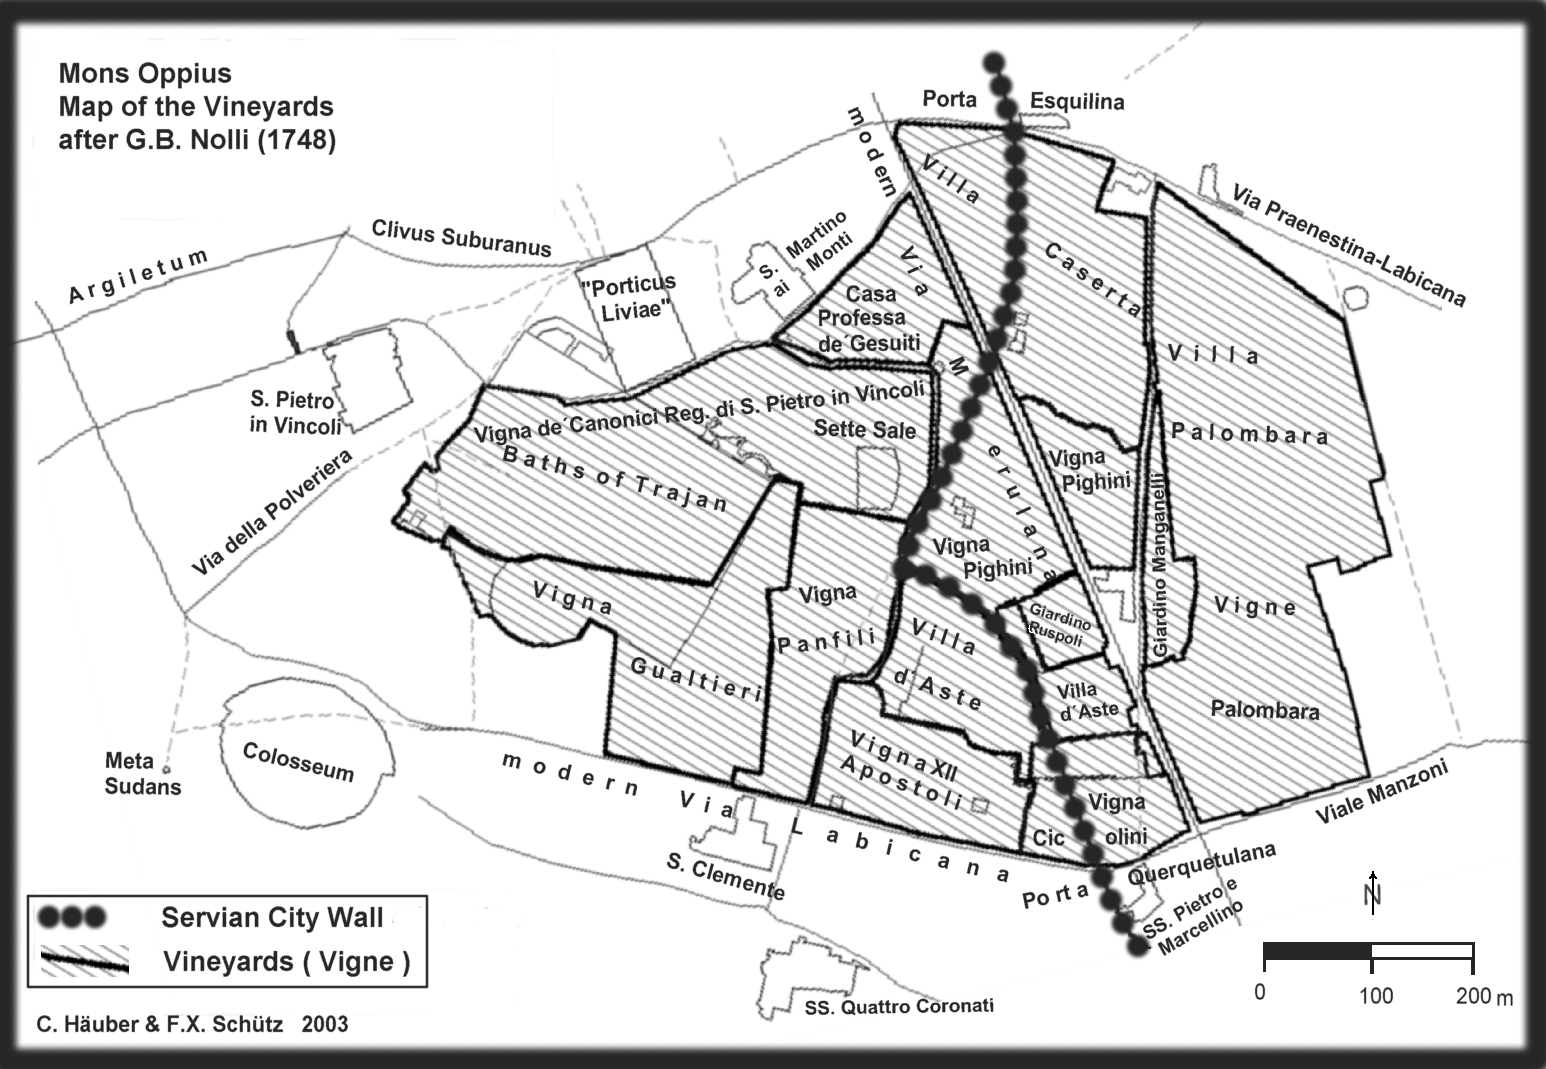
Figure 5. Mons Oppius. Map of the Vineyards after G.B. Nolli´s map of Rome (1748)
For the Laokoon group (Fig. 6) various findspots have been suggested. The group was recovered in an ancient, subterranean, richly decorated room near the „Sette Sale“ (Fig. 7, no. 4). Figure 7 shows the suggested findspots (no. 1-7) (cf. La Rocca, 1998, p. 220; Häuber, Schütz, 2003). Häuber believes, the ancient building
called „Porticus with Piscina“ (Fig. 7, no. 5) may have been the actual findspot, and has suggested that this richly decorated ancient building belongs in the Augustan regio III (Fig. 8, label „Porticus Liviae?“). The Porticus Liviae is recorded for regio III by ancient literary sources.
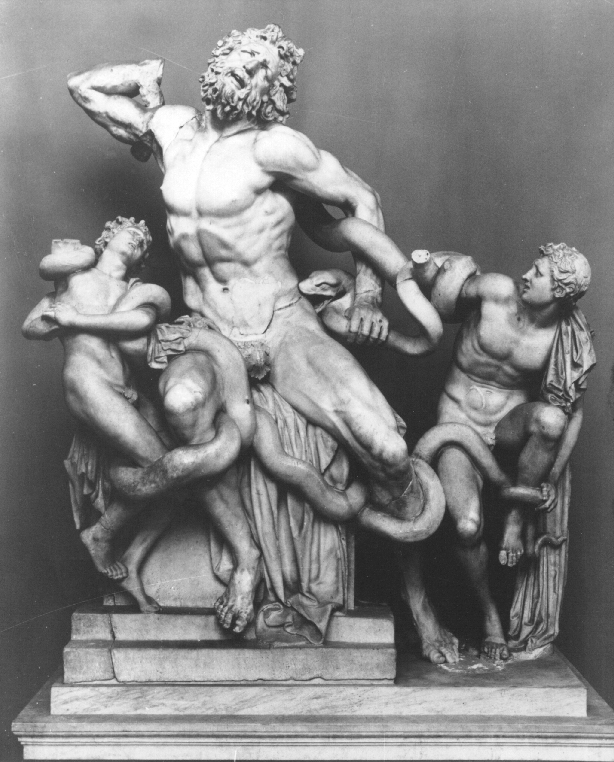
Figure 6. The Laokoon group in the Vatican. Photo: Courtesy DAI Rom 64.900, by: Koppermann

Figure 7. Possible findspots of the Laokoon group in the Vatican (no. 1-7)
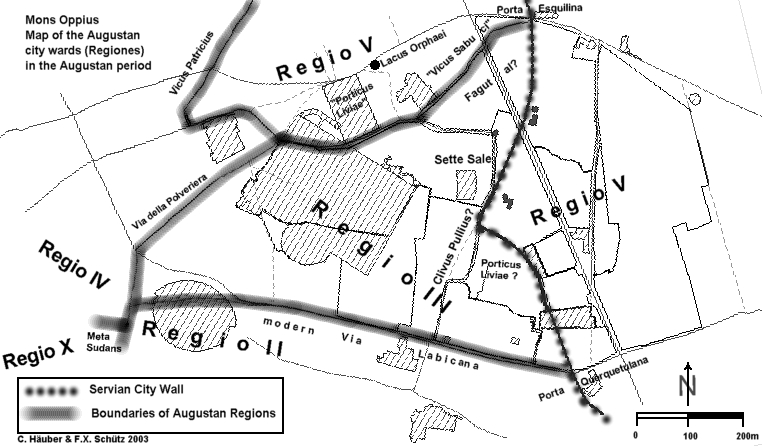
Figure 8. Mons Oppius. Map of the Augustan city wards (regiones) in the Augustan period
Since the fountain Lacus Orphaei of the Augustan regio V (Fig. 8, label „Lacus Orphaei“) was located on the southside of the Clivus Suburanus (Fig. 5, label „Clivus Suburanus“), the adjacent „Porticus Liviae“, recorded by the Severan marble plan, can perhaps be identified with another building, the Macellum Liviae of the Augustan regio V (Häuber, 1998 pp. 110,111). If true, the „Porticus with Piscina“ (Fig. 7, no. 5) may perhaps be identified with the Porticus Liviae, recorded by ancient literary sources for regio III.
ACKNOWLEDGEMENTS
We greatly benefitted from discussions with the partners in our research project, named „The eastern part of the Mons Oppius“, who are (in alphabetical order): Prof John Bodel of Brown University, Providence, R.I., USA, Prof Filippo Coarelli of the Università degli Studi di Perugia, Italy, Prof Michael F. Goodchild of the National Center for Geographic Information and Analysis and the Department of Geography at the University of California at Santa Barbara, CA, USA, Prof Adriano La Regina of the Soprintendenza Archeologica di Roma, and Prof Eugenio La Rocca and his collaborators Dr Susanna Le Pera and Dr Luca Sasso D'Elia of the Sovraintendenza BB.CC. of the Comune di Roma. Prof. La Regina kindly facilitated access to the ancient structure on Via Pasquale Villari / „Terme di Filippo“, and Prof La Rocca generously provided us with the digital cadastre and the photogrammetric data (which we used for our maps). These data were generated for his „Centro di Documentazione Forma Romae“.
For the photograph Figure 6 and for granting permission to publish it we are indebted to Dr Sylvia Diebner of the Deutsches Archäologisches Institut Rom. We thank Prof Hansgerd Hellenkemper of the Römisch-Germanisches Museum Köln for his kind permission to publish a detail of the map Figure 2.
REFERENCES
Albertz, J., 1991. Grundlagen der Interpretation von Luft- und Satellitenbildern: eine Einführung in die Fernerkundung, Darmstadt.
Amanti. M. et al. (eds.), 1995. Servizio Geologico Nazionale. Memorie descrittive della carta geologica d'Italia L, La Geologia di Roma. Il centro storico I, Roma.
Arnoldus-Huyzendveld, A., 2000. Geologia del Colle Oppio ed ipotesi sulla morfologia pre-Traiana. In: Volpe, R., Paesaggi urbani tra Oppio e Fagutal. Mélanges de l´École française de Rome, Antiquité, 112, 2, pp. 529-533.
Brienza, E., 1998a. La planimetria di G. B. Nolli e la topografia di Roma, unpublished Tesi di laurea, Università di Roma „La Sapienza“; 1998b. Cartografia storica e cartografia numerica. La pianta del Nolli e il GIS. In: Bevilacqua, M., Exhibition-cat. Roma nel secolo dei Lumi, Napoli, pp. 199-202.
Claridge, A, 1998. Rome. An Oxford Archaeological Guide, Oxford - New York.
Comune di Roma (ed.), 1991. Atlante di Roma. La forma del centro storico in scala 1:1000 nel fotopiano e nella carta numerica, Venezia, 4th ed. 1996.
Chevallier, R., 1957. Bibliographie des applications archéologiques de la photographie aérienne, Casablanca. (= Bulletin d´archeologie marocaine supplément; 2).
Coarelli, F., 1974. Guida Archeologica di Roma con la collaborazione di Luisanna Usai per la parte cristiana,Verona, 5. ed. aggiornata 1989.
Coarelli, F., 1980. Roma: Guide archeologiche Laterza1, Roma-Bari, 2nd ed. 1981, 3rd ed.1983, 4th ed. 1994, 5th rev. ed. 1995, nuova edizione 2001a, Roma-Bari.
Coarelli, F., 2001b. Il sepolcro e la casa di Servio Tullio. Eutopia, nuova serie I, 1-2, pp. 7-43.
D'Elia, L. Sasso, 1994. Problemi di Codifica in un Data-Base Territoriale. In: Comune di Roma, Regione Lazio (eds.). La Cartografia dei Beni Storici, Archeologici e Paesistici nelle Grandi Aree Urbane dal Censimento alla Tutela. Atti del Convegno, Roma, 26-27-28 Aprile 1990, Roma, pp. 99-102.
Frutaz, A. P., 1962. Le piante di Roma I-III, Roma.
Häuber, R. C., 1990. Zur Topographie der Horti Maecenatis und der Horti Lamiani auf dem Esquilin in Rom, mit vier Karten von H. Stöcker, Kölner Jahrbuch für Vor- und Frühgeschichte 23, pp. 11 107.
Häuber, C., 1998. „Art as a weapon“. Von Scipio Africanus maior bis Lucullus. Domus, Horti und Heiligtümer auf dem Esquilin. In: Cima, M., La Rocca, E. Horti Romani. 6. Suppl. BullCom, Roma, pp. 83-112.
Häuber, C., 2001, publ. in 2003. Wald und Siedlung im antiken Rom - Spuren heiliger Haine auf dem Mons Oppius. Siedlungsforschung. Archäologie - Geschichte - Geographie 19, pp. 57-94.
Häuber, C., Schütz, F.X., 2001. The Analysis of Persistent Structures - a Functionality of the Archaeological Information System FORTVNA. In: Strobl, J. et al. (eds.). AGIT XIII, Beiträge zum GIS-Symposium Salzburg 2001, Heidelberg. pp. 227-237.
Häuber, C., Schütz, F.X., 2003. Einführung in Archäologische Informationssysteme (AIS). Ein Methodenspektrum für Schule, Studium und Beruf mit Beispielen auf CD, Mainz (forthcoming).
Harari, M., 1997. .Archeologia Dal Cielo. In: ARCHEO, Anno XII, numero 5 (147), Maggio 1997, pp. 49-85.
Holcomb, D.W., 1996. Radar Archaeology: Space Age Tool Aid in Uncovering the Past. in : EOM (Earth Observation Magazine), Volume 5, Number 9, September 1996, pp. 22-26.
Istituto Nazionale di Archeologia e Storia dell'Arte (ed.), 1989 2000. Rodolfo Lanciani, Storia degli scavi di Roma e notizie intorno le collezioni Romane di antichità I-VI, Roma.
Lanciani, R., 1893 1901. Forma Urbis Romae (fols. 1-46), Milano. Reprint 1988, Roma.
Lanciani, R., 1902-1913. Storia degli scavi di Roma e notizie intorno le collezioni Romane di antichità I-IV, Roma.
La Rocca, E., 1998. Artisti rodii negli horti romani. In: Cima, M., La Rocca, E. Horti Romani. 6. Suppl. BullCom, Roma, pp. 203-274
La Rocca, E., 2001. The project "Nuova Forma Urbis Romae". In: APA, 132nd Annual Meeting, Abstracts, San Diego, CA, January 2-6, 2001, Philadelphia, PA, p. 200.
Panella, C. (ed.), 1996. Meta Sudans I. Un'area sacra in Palatio e la valle del Colosseo prima e dopo Nerone, Roma.
Panella, C., Arnoldus-Huyzendveld, A., 1996. Inquadramento geologico e geomorfologico della valle del Colosseo. In: Panella, C. (ed.), 1996. Meta Sudans I. Un'area sacra in Palatio e la valle del Colosseo prima e dopo Nerone, Roma, pp. 9-19.
Richardson, L., jr., 1992. A New Topographical Dictionary of Ancient Rome, Baltimore - London.
Sabins, F. F., 1999. Remote sensing: principles and interpretation, second printing, 3d ed., New York.
Schneider, S., 1974. Luftbild und Luftbildinterpretation, Berlin, New York. (= Lehrbuch der Allgemeinen Geographie, Band XI).
Schütz, F.X., Häuber, C., 2001. Reconstructing Ancient Rome using Remote Sensing and GIS-Technology: The Archaeological Information System FORTVNA. In: Jürgens, C. (ed.): Remote Sensing of Urban Areas (Regensburger Geographische Schriften, Heft 35). pp. 91-92; pp. 283-294 (on Supplement CD-ROM).
Scollar, I., 1965. Archäologie aus der Luft. Düsseldorf.
Steinby, E. M. (ed.), 1993-2000. Lexicon Topographicum Urbis Romae I-VI, Roma.
Volpe, R., 2000. Paesaggi urbani tra Oppio e Fagutal. Mélanges de l´École française de Rome, Antiquité, 112, 2, pp. 511-556.
Seit der hier publizierte gemeinsame Aufsatz (2003) erschienen ist, haben wir viele darin behandelte Themen weiter verfolgt.
Unter anderem zu den beiden in diesem Text behandelten topographischen Beispielen, `das Grab des Königs Servius Tullius auf dem Mons Oppius´ und `der Fundort der Laokoongruppe in den Horti des Maecenas´, zu den `14 augusteischen Regionen der Stadt Rom´, zur `Porticus Liviae der augusteischen Regio III´, zur `Identifizierung der Porticus mit Piscina mit dem ägyptischen Heiligtum Isis et Serapis der augusteischen Regio III´, zum `Macellum Liviae der augusteischen Regio V´, zu den `Vigne auf dem Mons Oppius auf Giambattista (G.B.) Nollis Großer Romkarte von 1748´, und zum `Verlauf der Servianischen Stadtmauer auf der Ostseite Roms, von der Porta Esquilina bis zur Porta Capena´.
Vergleiche die im Folgenden in chronologischer Reihenfolge aufgelisteten Publikationen und unsere Karten, die im Zusammenhang dieser Publikationen entstanden sind; diese Karten sind auf unserem Webserver open access publiziert.
Publikationen:
HÄUBER, C., SCHÜTZ, F.X. 2004, Einführung in Archäologische Informationssysteme (AIS). Ein Methodenspektrum für Schule, Studium und Beruf mit Beispielen auf CD (Mainz am Rhein: Philipp von Zabern 2004).
HÄUBER, C. 2006, "Il luogo del ritrovamento del gruppo del Laocoonte e la domus Titi imperatoris (Plin. Nat. Hist. 36,37-38), in: F. BURANELLI, P. LIVERANI and A. NESSELRATH 2006, pp. 41-47; cf. pp. 201-217 (bibliography).
BURANELLI, F., LIVERANI, P., NESSELRATH A. (eds.) 2006, Exhibition-cat. Laocoonte. Alle origini dei Musei Vaticani, quinto centenario dei Musei Vaticani 1506-2006 (Città del Vaticano, Musei Vaticani, 2006-2007), Roma: <<L'ERMA>> di Bretschneider 2006.
HÄUBER, C. 2009, "Gli horti in età flavia", in: F. COARELLI 2009, pp. 312-319.
COARELLI, F. (ed.) 2009, Exhibition-cat. Divus Vespasianus. Il bimillenario dei Flavi (Roma, Colosseo, Curia, Criptoportico "neroniano", 2009 - 2010), Milano: Mondadori 2009.
HÄUBER, C. 2014, The Eastern Part of the Mons Oppius in Rome: the Sanctuary of Isis et Serapis in Regio III, the Temples of Minerva Medica, Fortuna Virgo and Dea Syria, and the Horti of Maecenas. With Contributions by Edoardo Gautier di Confiengo and Daniela Velestina, 22. Suppl. BullCom, Roma: <<L'ERMA>> di Bretschneider 2014.
HÄUBER, C. 2017, Augustus and the Campus Martius in Rome: the Emperor's rôle as Pharaoh of Egypt and Julius Caesar's Calendar Reform; the Montecitorio Obelisk, the Meridian Line, the Ara Pacis, and the Mausoleum Augusti in Honour of Eugenio La Rocca on the Occasion of His 70th Birthday, FORTVNA PAPERS II, herausgegeben von F.X. SCHÜTZ und C. HAUBER (München: Hochschule München, 2017). Online at: https://fortvna-research.org/FORTVNA/FP2.html
HÄUBER, C. (forthcoming, Laocoon), Die Laokoongruppe im Vatikan - drei Männer und zwei Schlangen: `Ich weiß gar nicht, warum die sich so aufregen´ (Wolfgang Böhme) - die Bestätigung von F. Magis Restaurierung der Gruppe und der Behauptungen, sie sei für die Horti des Maecenas, später Domus Titi, geschaffen, und dort entdeckt worden. FORTVNA PAPERS IV, herausgegeben von F.X. SCHÜTZ und C. HAUBER (München: Hochschule München, 2022). Eine Vorschau/ Preview dieses Buches ist bereits open access veröffentlicht. Online at: https://fortvna-research.org/FORTVNA/FP4/FORTVNA_PAPERS_Vol4_Vorschau1.html
Links zu den Karten:
Alle Stadtmauen Roms - Karte des archaischen Rom mit den späteren Stadtmauern (Servianische und Aurelianische Stadtmauern)Datenschutzerklärung | Impressum